
Monitor engagement in Viva Engage with analytics
Viva Engage provides robust analytics to help you better understand the impact of your posts. Analytics provide metrics that let you monitor:
-
Your own engagement (through personal, Answers, and conversation analytics)
-
Engagement within the communities you visit (through community analytics).
Note: Except for conversation analytics, most dashboard analytics are only available to customers that have a Microsoft Viva Suite or Employee Communications and Communities license.
Open the Analytics dashboard
Analytics are visible to anyone who has created a post in Viva Engage and to leaders’ delegates.
Use one of these methods to open your Analytics dashboard:
-
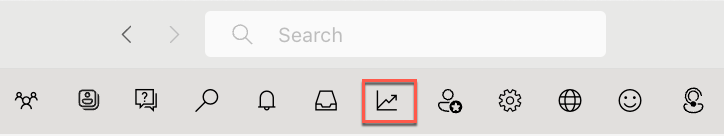
From the Viva Engage navigation bar, select the analytics icon.
-
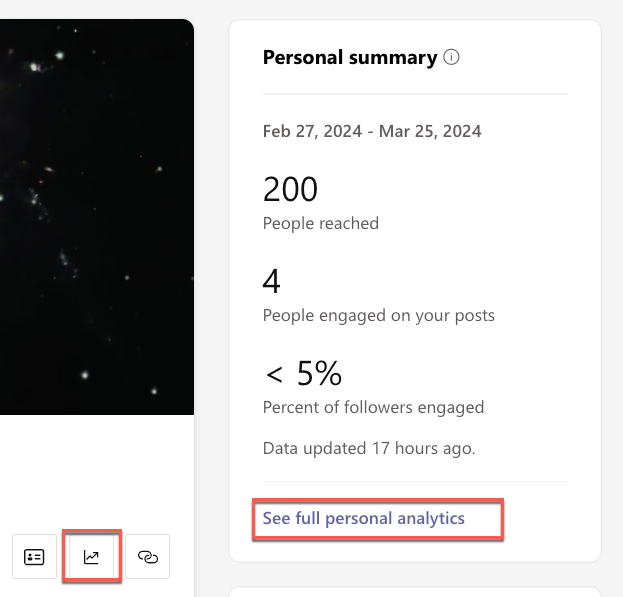
On your storyline or Answers page, in the Personal summary tile on the right, select See full personal analytics or the analytics icon below your cover photo.
Your dashboard shows metrics for Personal analytics and Answers analytics that refresh every 24 hours.Tip: Hover over each metric to find a tool tip with more information about that metric.
Personal analytics tracks the following metrics:
|
Your reach |
A count of people who viewed, reacted or commented on your posts |
|
Reach breakdown |
A count of people who are viewing, reacting, or commenting |
|
Engaged breakdown |
The percentage of people who reacted or commented |
|
Top conversations |
The most popular conversations you have started |
|
Reactions to your posts |
A unique count of reactions on all your posts |
|
Top comments on your posts |
The comments on your posts with the most reactions |
To see trends, use these dashboard filters:
|
Date range |
Date range lets you see conversation trends starting from the date a post is created and beyond. Date ranges represent changes (deltas) for the selected period. You can filter on 7days, 28days, 90days, and 365days. For example, by selecting 7days, you can see the week-over-week change, whereas 90days shows quarter-over-quarter changes. |
|
Destination |
Use this filter to include data across communities and storyline, or only storyline. |
Note: Audience related metrics are only visible to leaders who have been identified by an admin or corporate communicator and have assigned audiences. For details, see Identify leaders and manage audiences in Viva Engage.
To understand the performance of questions and answers you engage with, view Answers analytics. These analytics are visible to anyone who has posted or answered a question in Engage, either on the Answers tab or in a community.
Answer analytics tracks the following metrics:
|
People you helped |
Your impact based on the number of people who engaged with a question you asked or answered. For details, see Answers in Viva: Understanding Time Saved & People Helped - Microsoft Community Hub |
|
Answers summary |
Analytics for questions you answered |
|
Questions summary |
Analytics for the questions you asked |
|
Questions you engaged in |
A breakdown of the most engaged questions you asked or answered |
Here, you can see a detailed breakdown of activity for Viva Engage posts in real time. Conversation analytics are visible to the post creators, their delegates, and corporate communicators. Community admins can view conversation analytics for the communities they manage.
-
Go to a conversation in Viva Engage, select the ellipse icon, and then select View analytics. Alternatively, select the Seen by count that appears on all threads.
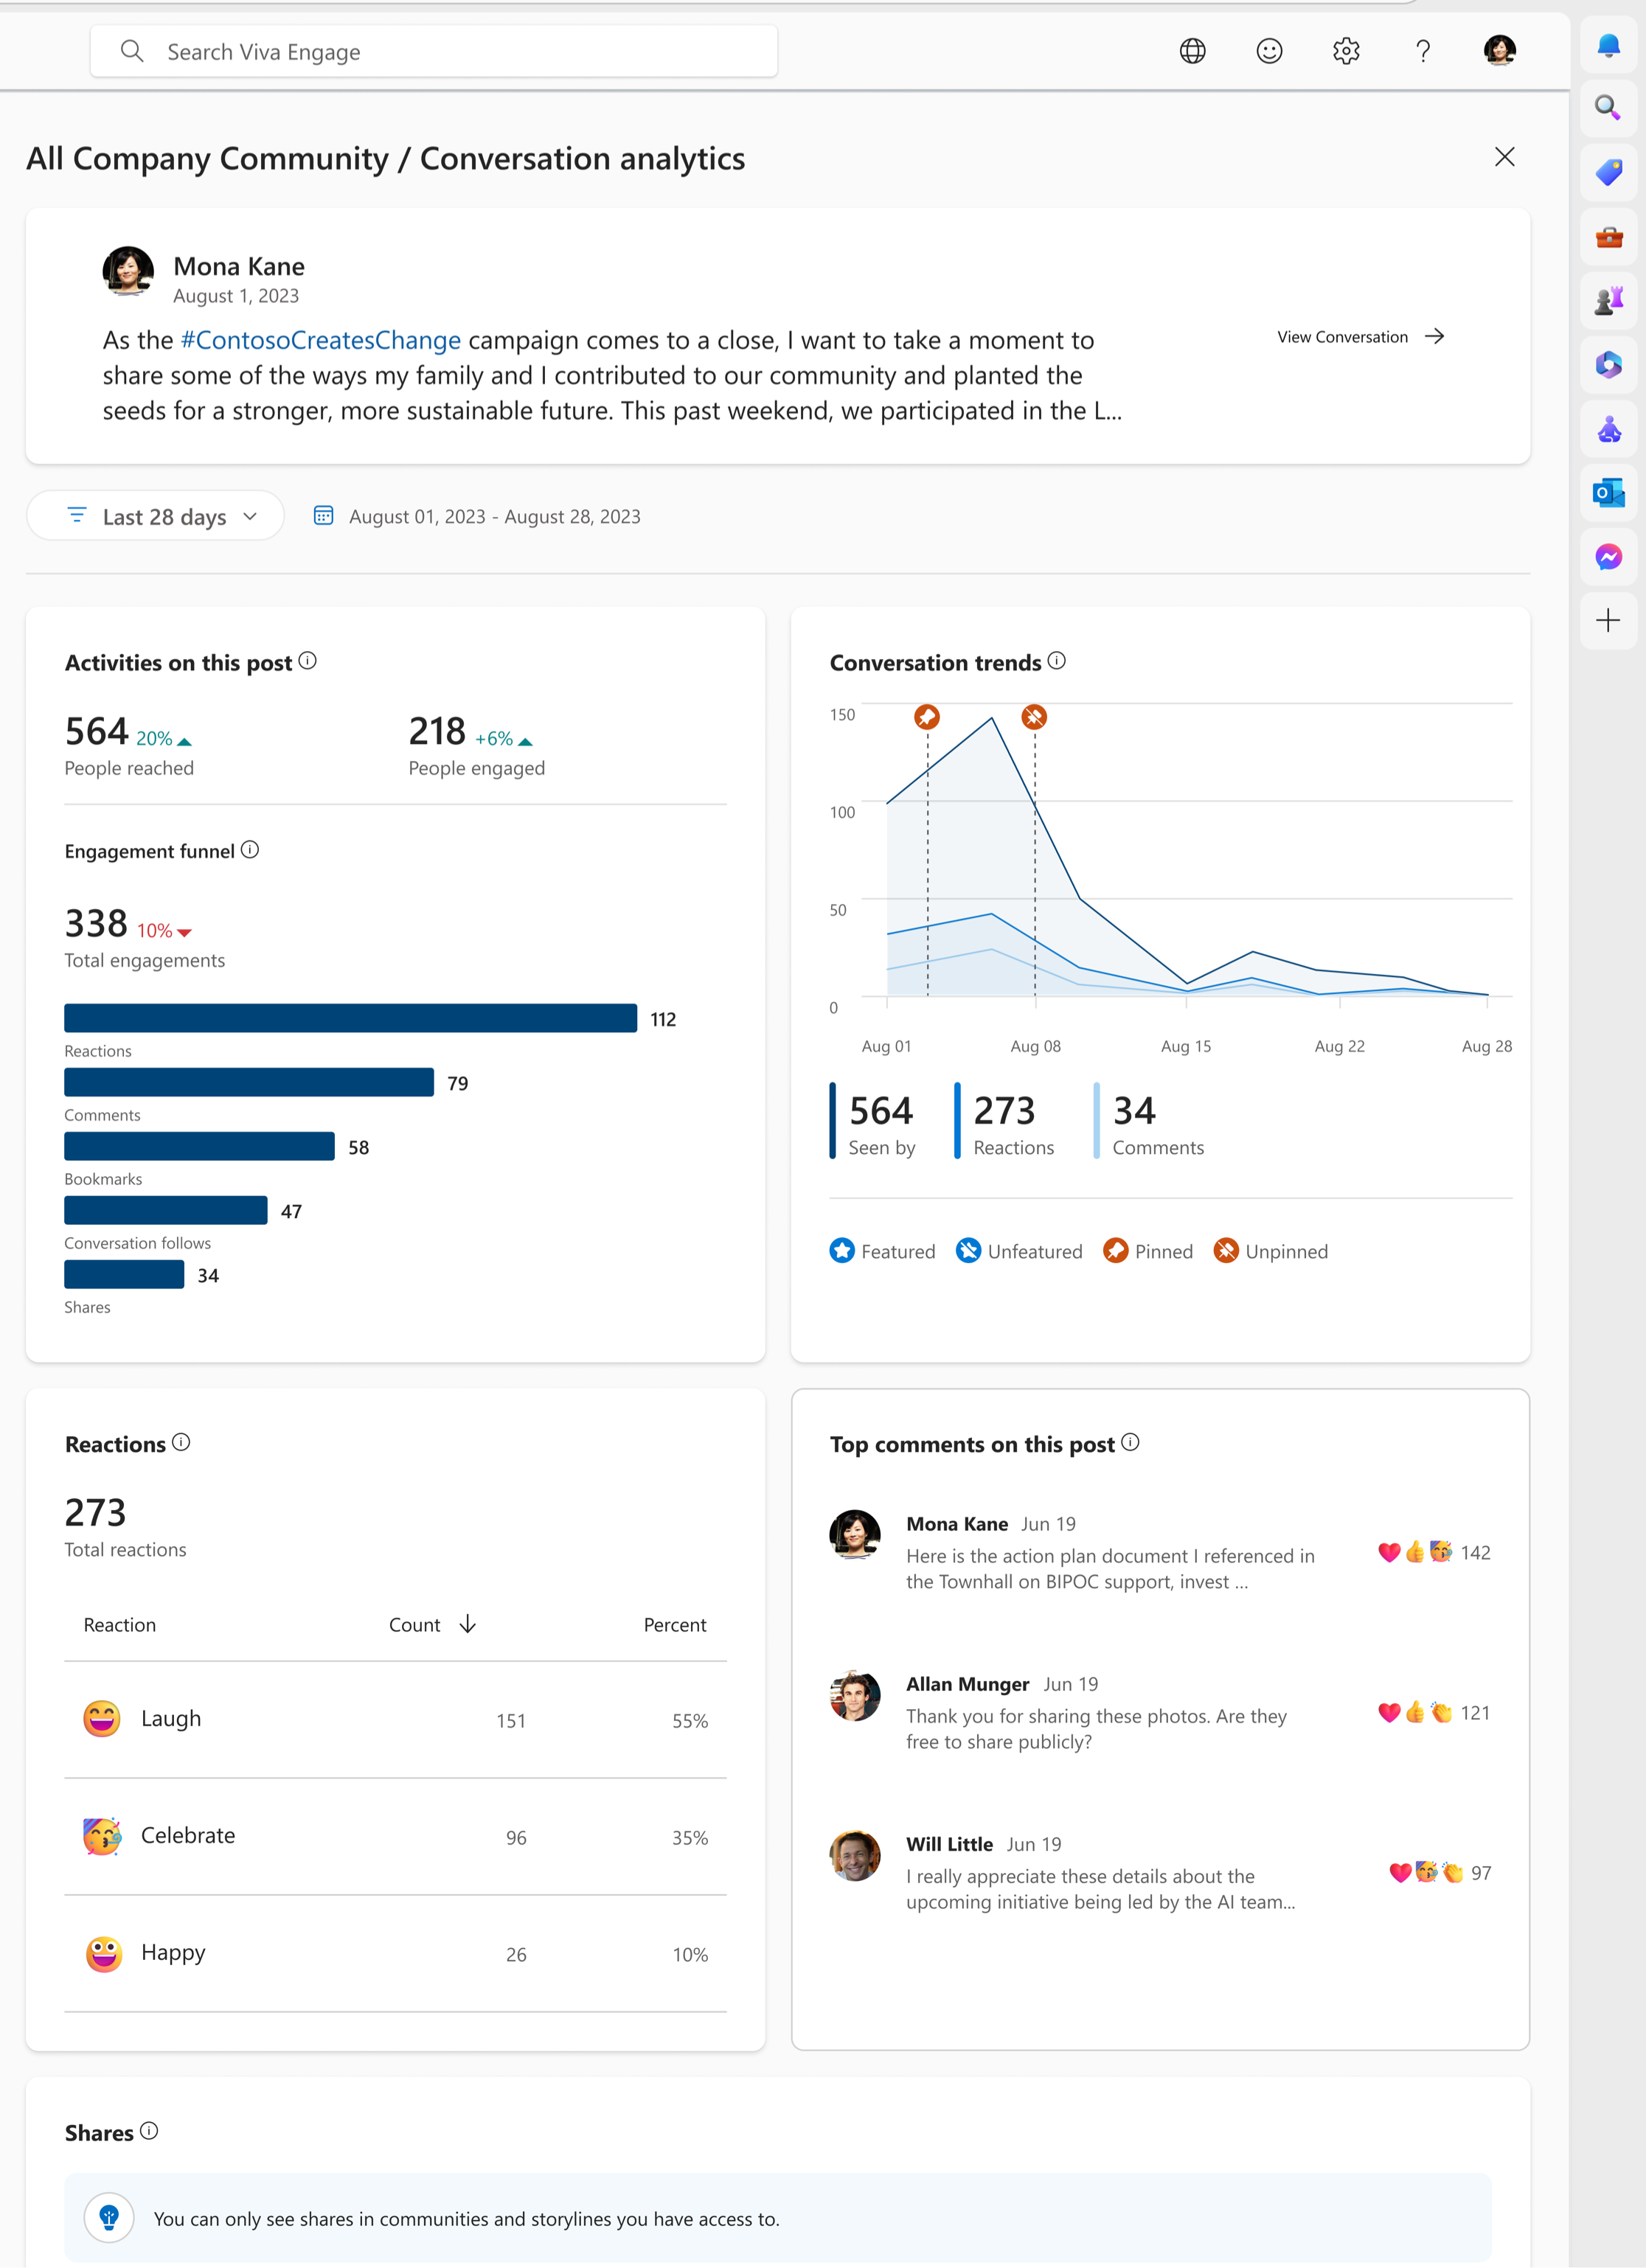
Conversation analytics tracks the following metrics:
|
People reached |
The number of people who viewed, reacted or replied |
|
People engaged |
The number of people who reacted or replied |
|
Engagement funnel |
The types of engagement happening on your post. Includes detailed conversation-specific activities like bookmarks and shares. |
|
Conversation trends |
Total users who have viewed, reacted and commented to the post in the selected time frame. In the case where a conversation has been featured or pinned, you'll see those actions represented in the graph. |
|
Reactions breakdown |
Total reactions and the type of reactions used |
|
Top comments on post |
An overview of the most engaged comments on the post |
|
Shares |
Shows how and where this post has been shared. Metrics in this table relate to the new post created upon share. |
Conversation analytics tracks these additional metrics in Viva Engage premium:
|
Advanced people reached and engaged |
Percentage of followers and the audience or community reached, depending on where the post is created. If a post is created within a community, community reach is displayed. If a post is created on storyline, followers reached is displayed. If the post is created on storyline by a leader, audience reached is displayed. |
|
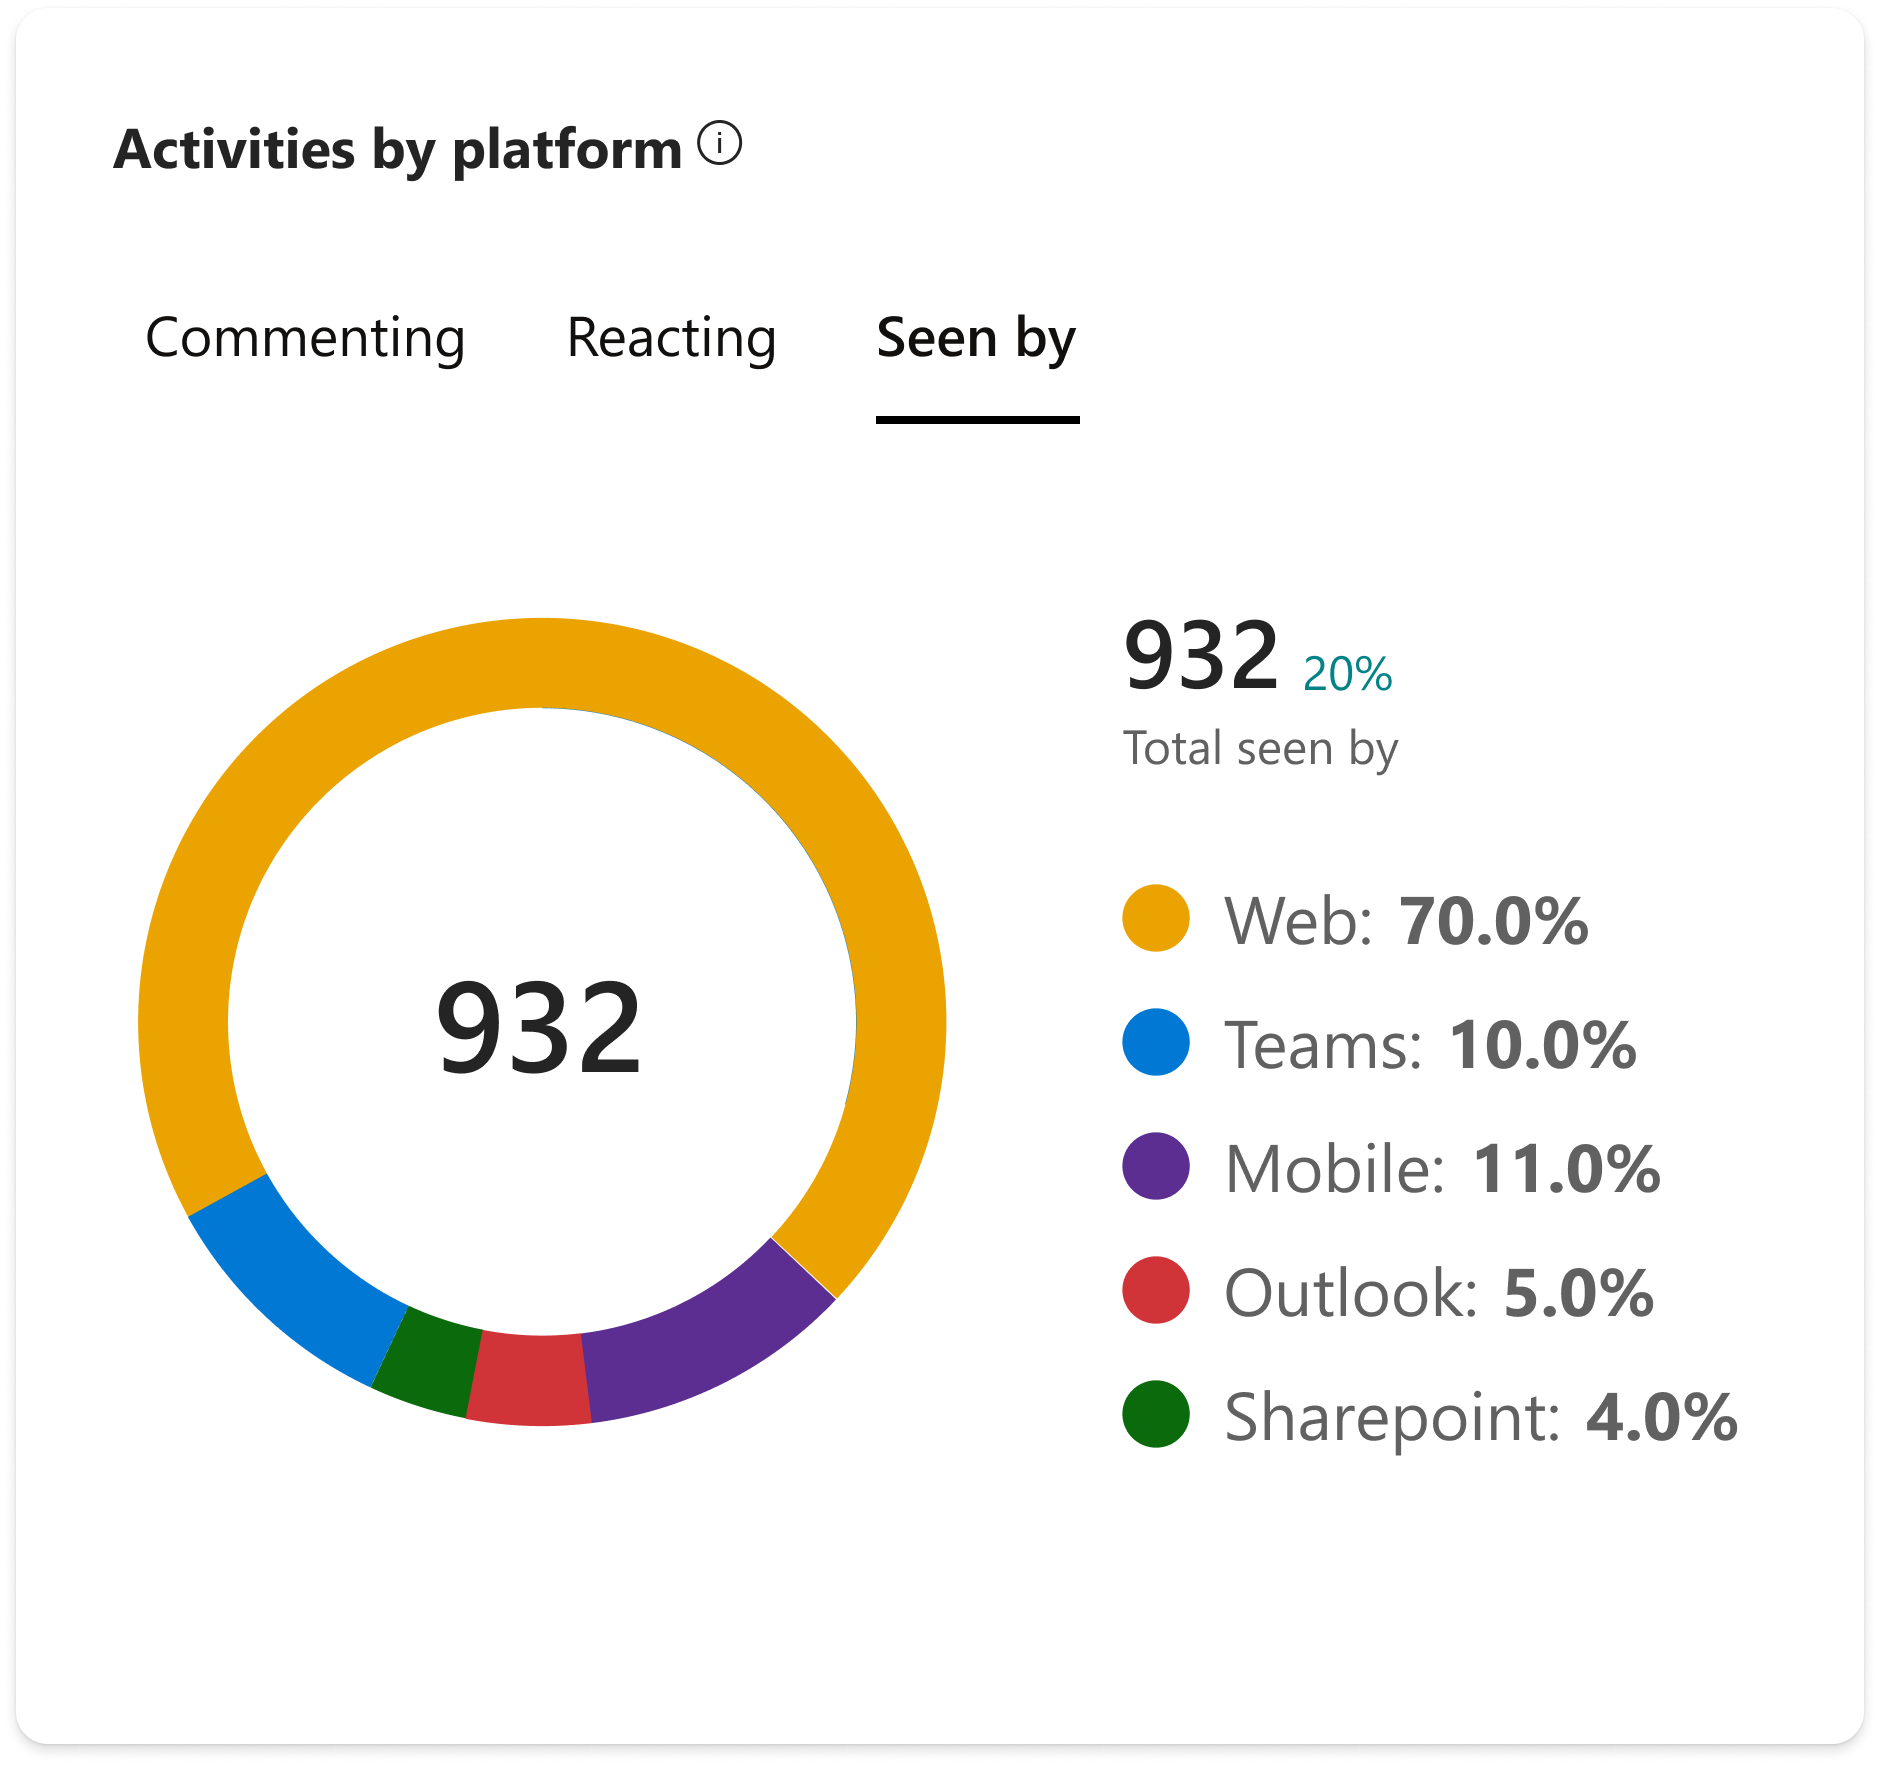
Activities by platform |
Platforms from where comments, reactions and views coming. This metric is only available on announcement type posts. |
|
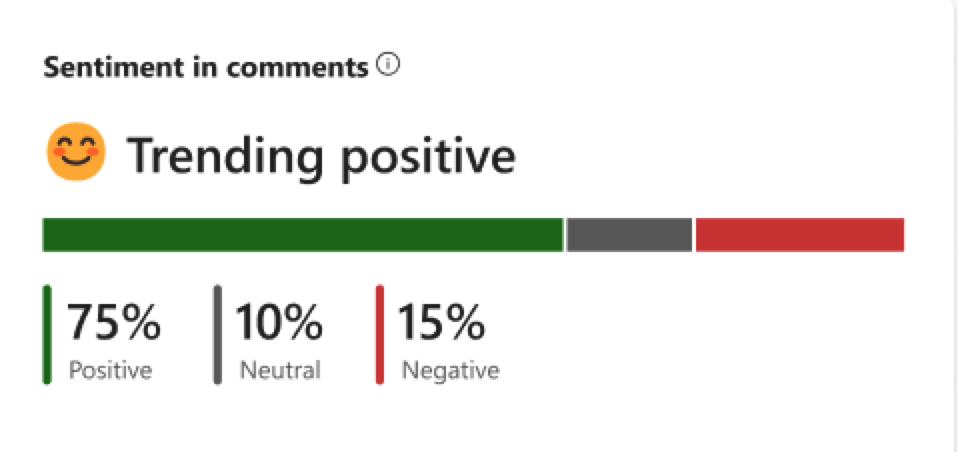
Sentiment in comments |
Average sentiment across all comments in post. This metric is only available on posts with at least five unique commentors. For details, see Sentiment and theme analysis in Viva Engage - Microsoft Support. |
For a deep dive on Viva Engage community analytics, see View community insights in Viva Engage.
Learn more


Need more help?
Want more options?
Explore subscription benefits, browse training courses, learn how to secure your device, and more.


Communities help you ask and answer questions, give feedback, and hear from experts with rich knowledge.


