
The data profiling tools provide intuitive ways to clean, transform, and understand query data, such as key statistics and distributions. In addition, by using the Count Rows command, you can also get a row count of all your query data.
By default, Power Query profiles data over the first 1,000 rows. To change the profile to operate over the entire dataset, in the lower-left corner of your editor, select either Column profiling based on to 1000 rows or Column profiling based on entire data set.
-
To open a query, locate one previously loaded from the Power Query Editor, select a cell in the data, and then select Query > Edit. For more information see Create, load, or edit a query in Excel.
-
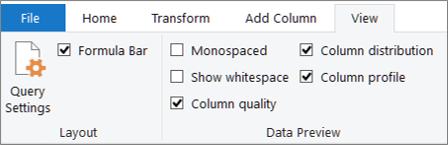
Select View.
-
In the Data Preview group, select one or more of the elements you want to display:
What follows is more detail about available statistics and additional steps you can do.
Quick commands
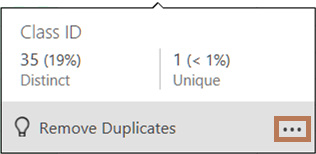
To further clean the data as you view the profiles, the following commands are available when you click More (…) at the bottom right of the various dialog boxes: Keep Duplicates, Keep Errors, Remove Duplicates, Remove Empty, Remove Errors, and Replace Errors. For more information, see Keep or remove duplicate rows, Remove or keep rows with errors, and Replace values.
Column Quality
Displays data profiles indicating key percentages in a bar chart of three categories: Valid (green), Error (red), Empty (dark grey) for each column.
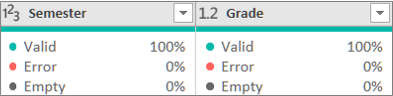
Hover over the display to see a summary enlargement. Select More (…) for additional commands to perform.
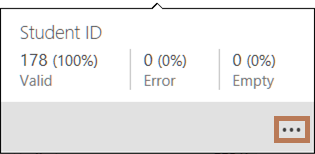
Tip If you haven't yet set the options in the Data Preview group in the ribbon, you can quickly see column quality profile data, by right clicking on the thin dark gray bar, and then selecting Show the Quality Column Peak. You can also quickly copy the data values.
Column Distribution
Displays a visualization of frequency and distribution under each column, and sorted in descending order of the value with the highest frequency.
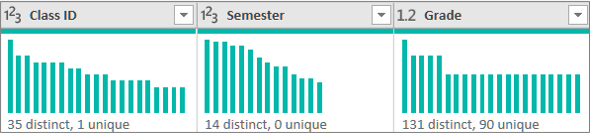
Hover over the bulleted items to see a summary enlargement. Select More (…) for additional commands to perform.
Column Profile: Column statistics and value distribution
Displays a more thorough view of each column and the statistics associated to it.
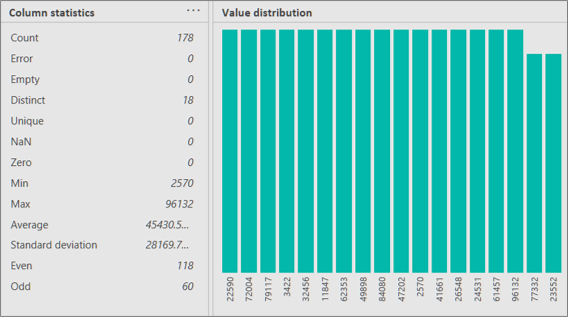
Tip On the far right, select More (…) to copy the data.
In addition, you can do the following:
-
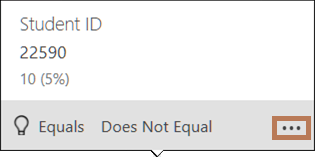
Hover over each bar in the graph to see more detail. To filter that bar, select Equals or Does Not Equal. For additional commands, select More (...) or right click on the bar.
-
On the far right, select More (…), select Group by, and then select additional commands, which vary depending on the data type.
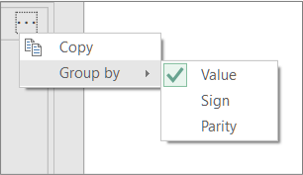
You can continue to interact with individual values in the chart.
Often, you want to see the number of rows returned after you get data. The Count Rows command returns the actual row count of the data and is not affected by the Column Profile setting.
-
To open a query, locate one previously loaded from the Power Query Editor, select a cell in the data, and then select Query > Edit. For more information see Create, edit, and load a query in Excel (Power Query).
-
Select Transform> Count Rows.
-
Optionally, select the Transform tab under Number Tools and select Convert to Table or Convert to List so you can load the results to a worksheet.
-
Optionally, use the various number commands in the Transform group. For more information, see Add a column based on a data type.


